Know the season before you choose the week.
The world, month by month
typical high in Januarytypical high in Februarytypical high in Marchtypical high in Apriltypical high in Maytypical high in Junetypical high in Julytypical high in Augusttypical high in Septembertypical high in Octobertypical high in Novembertypical high in December- typical high in Januarytypical high in Februarytypical high in Marchtypical high in Apriltypical high in Maytypical high in Junetypical high in Julytypical high in Augusttypical high in Septembertypical high in Octobertypical high in Novembertypical high in December 40°F4°C95°F35°C
The land is shaded by its typical high in January, the planning map's own layer; every place we cover is listed below.The land is shaded by its typical high in February, the planning map's own layer; every place we cover is listed below.The land is shaded by its typical high in March, the planning map's own layer; every place we cover is listed below.The land is shaded by its typical high in April, the planning map's own layer; every place we cover is listed below.The land is shaded by its typical high in May, the planning map's own layer; every place we cover is listed below.The land is shaded by its typical high in June, the planning map's own layer; every place we cover is listed below.The land is shaded by its typical high in July, the planning map's own layer; every place we cover is listed below.The land is shaded by its typical high in August, the planning map's own layer; every place we cover is listed below.The land is shaded by its typical high in September, the planning map's own layer; every place we cover is listed below.The land is shaded by its typical high in October, the planning map's own layer; every place we cover is listed below.The land is shaded by its typical high in November, the planning map's own layer; every place we cover is listed below.The land is shaded by its typical high in December, the planning map's own layer; every place we cover is listed below. Hover the map for the figure at that spot (tap it on a phone). Drag the map and zoom it with the buttons.
At their best in January
this month137 of our places are at their best in January, by the rule set out on every page. The best-placed first.
- Abu Dhabi77°F25°C
- Doha74°F23°C
- Dubai79°F26°C
- Karachi79°F26°C
- La Paz80°F27°C
- Mugatrah79°F26°C
- Muscat78°F26°C
- Umluj78°F26°C
- Dhaka78°F26°C
- Murqquab78°F26°C
- Sanya78°F26°C
- Mowe Bay80°F27°C
- Hamraniyah77°F25°C
- Karatta75°F24°C
- Mahader Liwa79°F26°C
- Con Dao77°F25°C
- Manama69°F21°C
- Dibba Al-Baya77°F25°C
- Bahía de Banderas81°F27°C
- Oaxaca79°F26°C
- Big Pine Key70°F21°C
- Sosian80°F27°C
- Manpur77°F25°C
- San Pedro de Atacama80°F27°C
At their best in February
this month134 of our places are at their best in February, by the rule set out on every page. The best-placed first.
- Abu Dhabi79°F26°C
- Con Dao77°F25°C
- Doha76°F24°C
- Hamraniyah78°F26°C
- La Paz79°F26°C
- Muscat79°F26°C
- Umluj79°F26°C
- Manama70°F21°C
- Dibba Al-Baya78°F26°C
- Dubai81°F27°C
- Karatta75°F24°C
- Bahía de Banderas81°F27°C
- Murqquab81°F27°C
- Sanya79°F26°C
- Big Pine Key70°F21°C
- Kuwait City71°F22°C
- Mugatrah81°F27°C
- Bamitha81°F27°C
- Thanagazi79°F26°C
- Aswan80°F27°C
- Agra77°F25°C
- Jaipur79°F26°C
- Cape Town82°F28°C
- Merricks North77°F25°C
At their best in March
this month106 of our places are at their best in March, by the rule set out on every page. The best-placed first.
- Kuwait City79°F26°C
- Manama75°F24°C
- Nizwa74°F23°C
- Cape Town80°F27°C
- La Paz81°F27°C
- Big Pine Key72°F22°C
- Con Dao79°F26°C
- Karatta73°F23°C
- Cairo79°F26°C
- Melbourne78°F26°C
- San Pedro de Atacama78°F26°C
- Bahía de Banderas81°F27°C
- Puebla79°F26°C
- Nassau79°F26°C
- Merricks North74°F23°C
- Umluj82°F28°C
- Shaharut73°F23°C
- Paiguano81°F27°C
- Canberra77°F25°C
- Dibba Al-Baya82°F28°C
- Palm Springs77°F25°C
- De Hoop81°F27°C
- Sea Island71°F22°C
- Buenos Aires80°F27°C
At their best in April
this month87 of our places are at their best in April, by the rule set out on every page. The best-placed first.
- Tel Aviv77°F25°C
- Big Pine Key75°F24°C
- Santiago76°F24°C
- Rancho Palos Verdes72°F22°C
- Ibiza71°F22°C
- Elounda72°F22°C
- Malibu76°F24°C
- Zannier Reserve80°F27°C
- Casablanca74°F23°C
- Nizwa82°F28°C
- Petra (Wadi Musa)76°F24°C
- Amman76°F24°C
- Santa Barbara73°F23°C
- Franschhoek79°F26°C
- Rabat74°F23°C
- Pretoria78°F26°C
- De Hoop76°F24°C
- Nicosia76°F24°C
- Paiguano76°F24°C
- Rancho Santa Fe70°F21°C
- Sea Island77°F25°C
- Los Angeles77°F25°C
- Providenciales76°F24°C
- Buenos Aires74°F23°C
At their best in May
this month132 of our places are at their best in May, by the rule set out on every page. The best-placed first.
- Andiparos71°F22°C
- Antimachia72°F22°C
- Lusaka78°F26°C
- Malibu79°F26°C
- Mykonos71°F22°C
- Rancho Palos Verdes74°F23°C
- Valletta71°F22°C
- Rancho Santa Fe73°F23°C
- Chora73°F23°C
- Kranidi76°F24°C
- Elounda80°F27°C
- Makhado NU80°F27°C
- Ibiza77°F25°C
- Santa Barbara77°F25°C
- Pylos75°F24°C
- Bodrum74°F23°C
- Casablanca78°F26°C
- Baku73°F23°C
- Spartià71°F22°C
- Tecate78°F26°C
- Los Olivos77°F25°C
- Sternes74°F23°C
- Yulara78°F26°C
- Algarve (Faro)73°F23°C
At their best in June
this month239 of our places are at their best in June, by the rule set out on every page. The best-placed first.
- Algarve (Faro)78°F26°C
- Andiparos78°F26°C
- Antimachia79°F26°C
- Ferreries76°F24°C
- Folegandros73°F23°C
- Ioulis75°F24°C
- Kigali80°F27°C
- Lagos76°F24°C
- M'Diq80°F27°C
- Melides80°F27°C
- Mykonos78°F26°C
- Nea Fokea80°F27°C
- Rancho Palos Verdes78°F26°C
- Rancho Santa Fe76°F24°C
- Santorini (Thira)77°F25°C
- Spartià78°F26°C
- Valletta79°F26°C
- La Línea de la Concepción80°F27°C
- Matetsi Private Game Reserve80°F27°C
- Lisbon78°F26°C
- Fort Bragg72°F22°C
- Maputo78°F26°C
- Taormina80°F27°C
- Marshall73°F23°C
At their best in July
this month264 of our places are at their best in July, by the rule set out on every page. The best-placed first.
- Big Sur72°F22°C
- Elk80°F27°C
- Folegandros76°F24°C
- Fort Bragg76°F24°C
- Ioulis79°F26°C
- Jenner73°F23°C
- Lagos79°F26°C
- Monachil80°F27°C
- Ningaloo77°F25°C
- Nyungwe78°F26°C
- Tías75°F24°C
- San Francisco75°F24°C
- Marshall75°F24°C
- Gold Beach70°F21°C
- Kruger National Park80°F27°C
- Žman76°F24°C
- Pacific City72°F22°C
- Maputo77°F25°C
- Newport Coast80°F27°C
- Nairobi75°F24°C
- Matetsi Private Game Reserve79°F26°C
- Kruger (Skukuza)79°F26°C
- Ferreries81°F27°C
- Vilanculos79°F26°C
At their best in August
this month260 of our places are at their best in August, by the rule set out on every page. The best-placed first.
- Big Sur73°F23°C
- Elk80°F27°C
- Folegandros77°F25°C
- Fort Bragg76°F24°C
- Gold Beach71°F22°C
- Ioulis80°F27°C
- Jenner73°F23°C
- Lusaka80°F27°C
- Marshall75°F24°C
- Ningaloo80°F27°C
- San Francisco75°F24°C
- Tías77°F25°C
- Monachil80°F27°C
- Lagos80°F27°C
- Pacific City73°F23°C
- Maputo79°F26°C
- Lizard74°F23°C
- Cannon Beach72°F22°C
- Žman77°F25°C
- Arusha76°F24°C
- Nyungwe78°F26°C
- Nairobi76°F24°C
- Makhado NU80°F27°C
- Thornybush81°F27°C
At their best in September
this month235 of our places are at their best in September, by the rule set out on every page. The best-placed first.
- Algarve (Faro)79°F26°C
- Andiparos80°F27°C
- Big Sur73°F23°C
- Elk79°F26°C
- Folegandros74°F23°C
- Fort Bragg76°F24°C
- Ioulis75°F24°C
- Jenner73°F23°C
- Lima73°F23°C
- Lizard76°F24°C
- Marshall76°F24°C
- Mykonos79°F26°C
- San Francisco77°F25°C
- Santorini (Thira)79°F26°C
- Tías77°F25°C
- Lagos78°F26°C
- Arusha80°F27°C
- Antimachia81°F27°C
- Nairobi79°F26°C
- Gold Beach70°F21°C
- Carmel69°F21°C
- Whitsundays77°F25°C
- Lisbon80°F27°C
- Melides81°F27°C
At their best in October
this month142 of our places are at their best in October, by the rule set out on every page. The best-placed first.
- Big Sur71°F22°C
- Lima74°F23°C
- Newport Coast79°F26°C
- Rancho Palos Verdes80°F27°C
- Rancho Santa Fe79°F26°C
- Tías76°F24°C
- Andiparos74°F23°C
- Mykonos74°F23°C
- Elounda80°F27°C
- Jenner70°F21°C
- San Francisco75°F24°C
- Mowe Bay75°F24°C
- Antimachia76°F24°C
- Athens78°F26°C
- Kranidi76°F24°C
- Lizard77°F25°C
- Santa Barbara81°F27°C
- Bodrum77°F25°C
- Healdsburg80°F27°C
- Chora76°F24°C
- Kanab78°F26°C
- Ibiza79°F26°C
- Groveland76°F24°C
- De Hoop74°F23°C
At their best in November
this month78 of our places are at their best in November, by the rule set out on every page. The best-placed first.
- Lima76°F24°C
- Mowe Bay78°F26°C
- Nizwa74°F23°C
- Shaharut77°F25°C
- Palm Springs80°F27°C
- Rancho Palos Verdes74°F23°C
- Malibu78°F26°C
- Oaxaca78°F26°C
- Santa Barbara74°F23°C
- San Miguel de Allende78°F26°C
- Rancho Santa Fe73°F23°C
- Elounda72°F22°C
- Los Angeles78°F26°C
- Morristown78°F26°C
- Hong Kong77°F25°C
- Islamabad78°F26°C
- Nicosia75°F24°C
- Petra (Wadi Musa)71°F22°C
- Orlando80°F27°C
- De Hoop76°F24°C
- Tel Aviv78°F26°C
- Los Olivos74°F23°C
- Macau79°F26°C
- Tecate75°F24°C
At their best in December
this month92 of our places are at their best in December, by the rule set out on every page. The best-placed first.
- Doha78°F26°C
- Lima78°F26°C
- Manama74°F23°C
- Mowe Bay79°F26°C
- Sanya79°F26°C
- Dibba Al-Baya80°F27°C
- Muscat80°F27°C
- Cape Town79°F26°C
- Manpur79°F26°C
- Bamitha78°F26°C
- Macau71°F22°C
- Kuwait City71°F22°C
- Dhaka81°F27°C
- Udaipur80°F27°C
- Hamraniyah81°F27°C
- Aswan80°F27°C
- Oaxaca79°F26°C
- La Paz81°F27°C
- Sawai Madhopur79°F26°C
- Xishuangbanna Dai Autonomous Prefecture77°F25°C
- Orlando76°F24°C
- Hong Kong69°F21°C
- Cairo74°F23°C
- Chiang Saen81°F27°C
By continent
every country we coverThe Americas
210 places · 36 countries
 Anguilla1 place
 Antigua & Barbuda1 place
 Argentina8 places
 Aruba1 place
 Bahamas2 places
 Barbados1 place
 Belize2 places
 Bermuda1 place
 Brazil5 places
 British Virgin Islands1 place
 Canada24 places
 Cayman Islands1 place
 Chile7 places
 Colombia3 places
 Costa Rica8 places
 Cuba1 placeCuraçao1 place
 Dominica1 place
 Dominican Republic3 places
 Ecuador3 places
 Grenada1 place
 Jamaica2 places
 Mexico17 places
 Nicaragua2 places
 Panama2 places
 Peru4 places
 Puerto Rico2 places
 Saint Barthélemy1 placeSaint Martin1 place
 St Kitts & Nevis1 place
 St Lucia1 place
 St Vincent & the Grenadines1 place
 Trinidad & Tobago1 place
 Turks and Caicos Islands2 places
 United States95 places
 Uruguay2 places
Europe
183 places · 38 countries
 Albania1 place
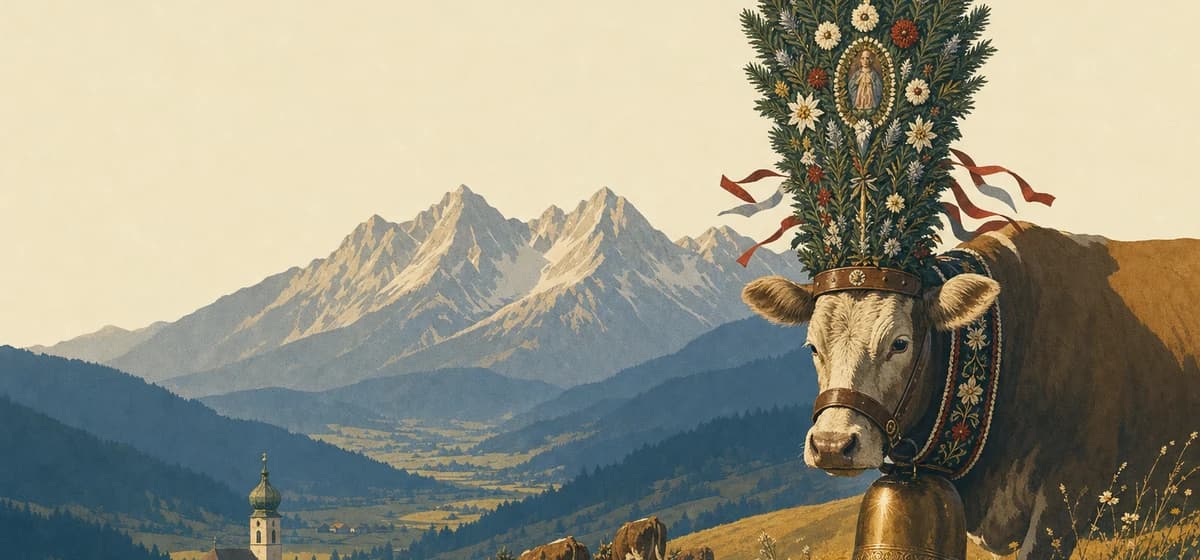 Austria10 places
 Belgium2 places
 Bosnia & Herzegovina1 place
 Bulgaria1 place
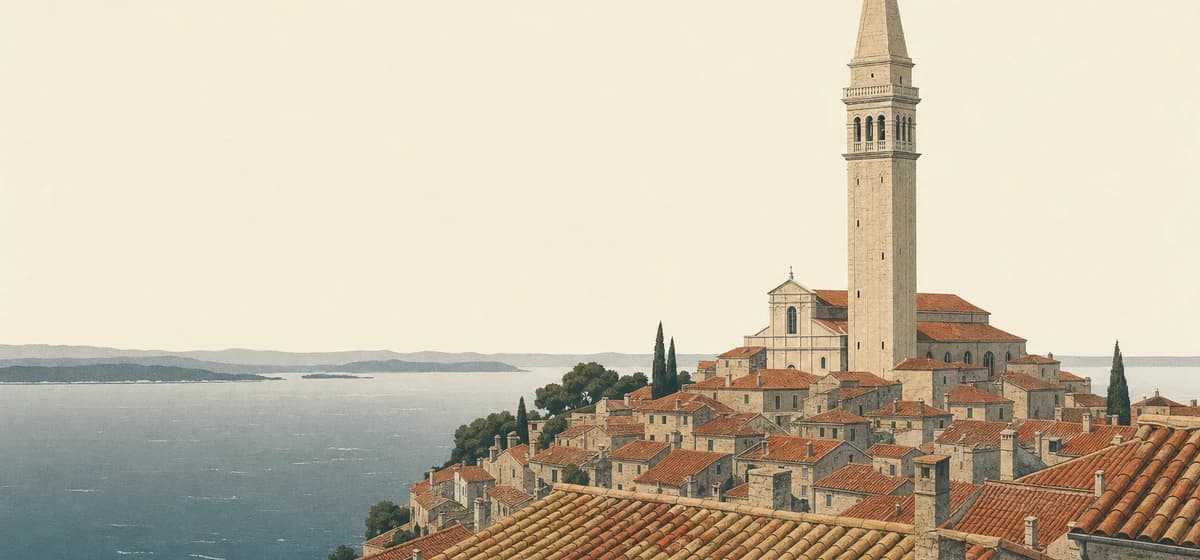 Croatia6 places
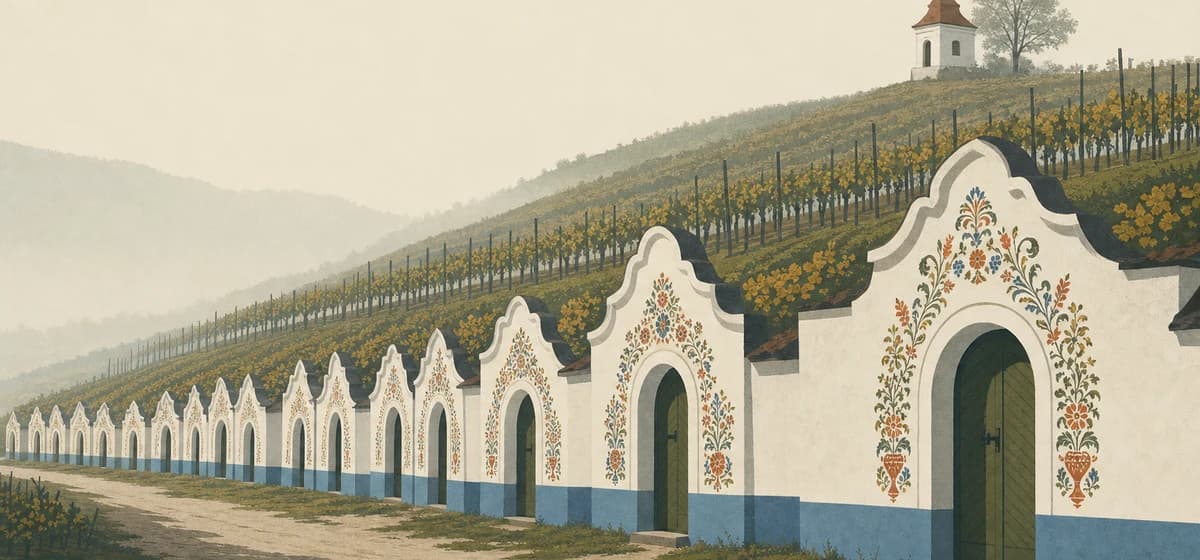 Czechia1 place
 Denmark1 place
 Estonia1 place
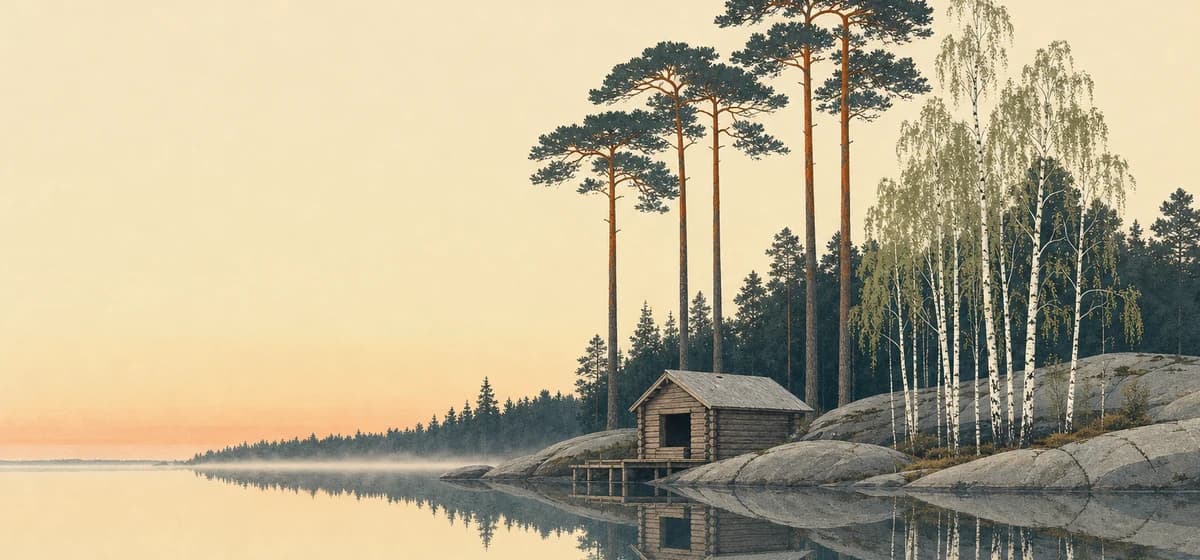 Finland3 places
 France20 places
 Germany7 places
 Greece14 places
 Hungary1 place
 Iceland8 places
 Ireland3 places
 Italy23 places
 Latvia1 place
 Lithuania1 place
 Luxembourg1 place
 Malta1 place
 Monaco1 place
 Montenegro3 places
 Netherlands1 place
 North Macedonia1 place
 Norway8 places
 Poland2 places
 Portugal8 places
 Romania1 place
 Russia2 places
 Serbia1 place
 Slovakia1 place
 Slovenia1 place
 Spain13 places
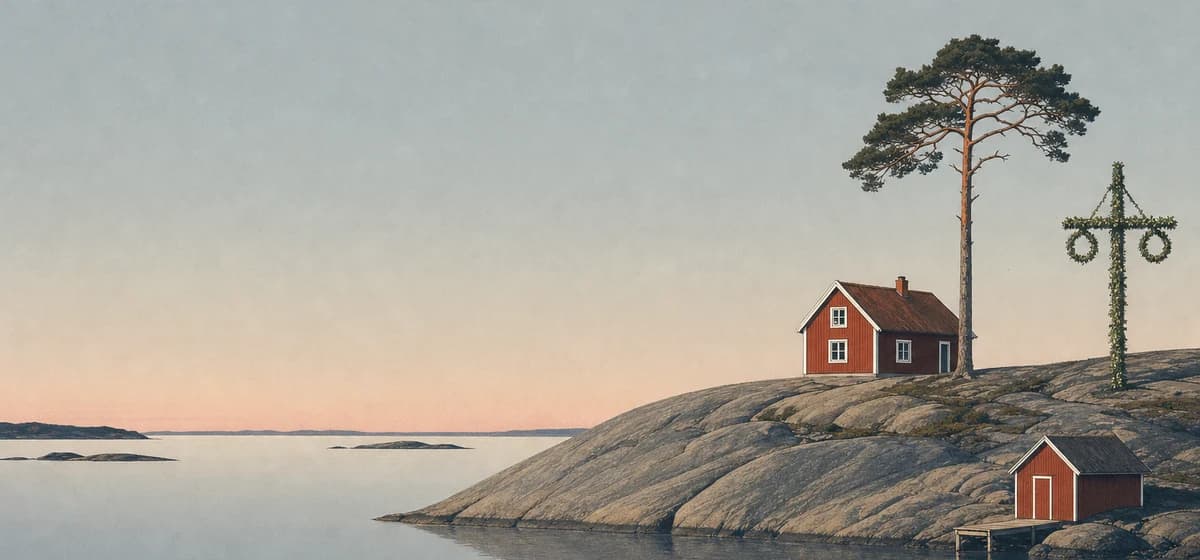 Sweden4 places
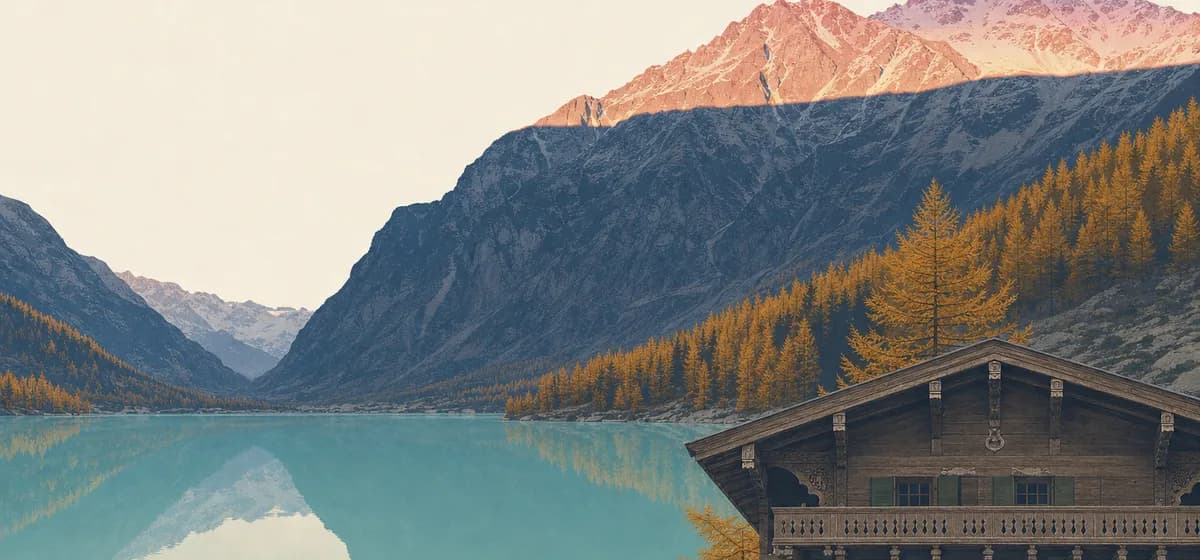 Switzerland16 places
 Ukraine1 place
 United Kingdom12 places
Asia
162 places · 40 countries
 Armenia1 place
 Azerbaijan1 place
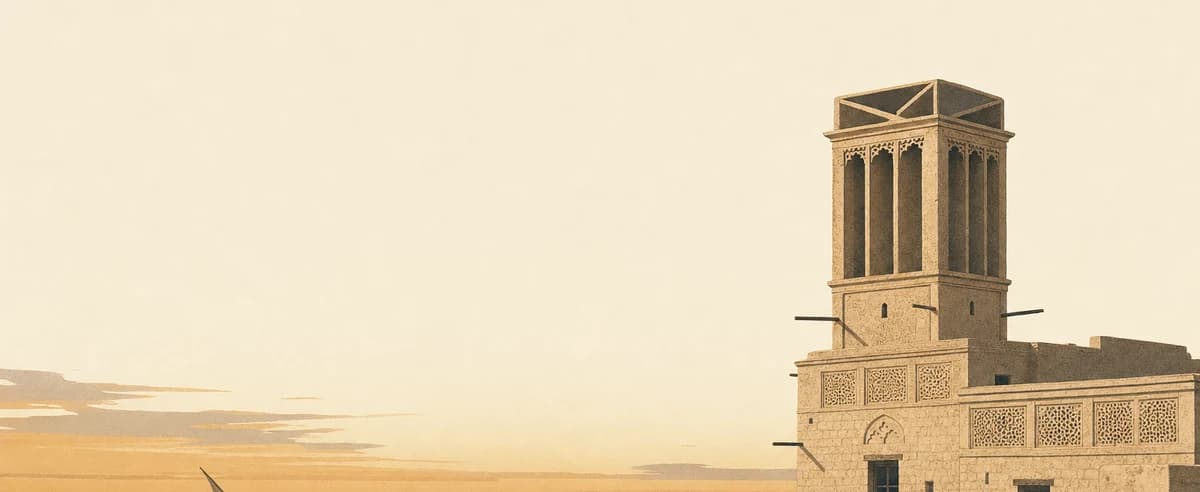 Bahrain1 place
 Bangladesh1 place
 Bhutan4 places
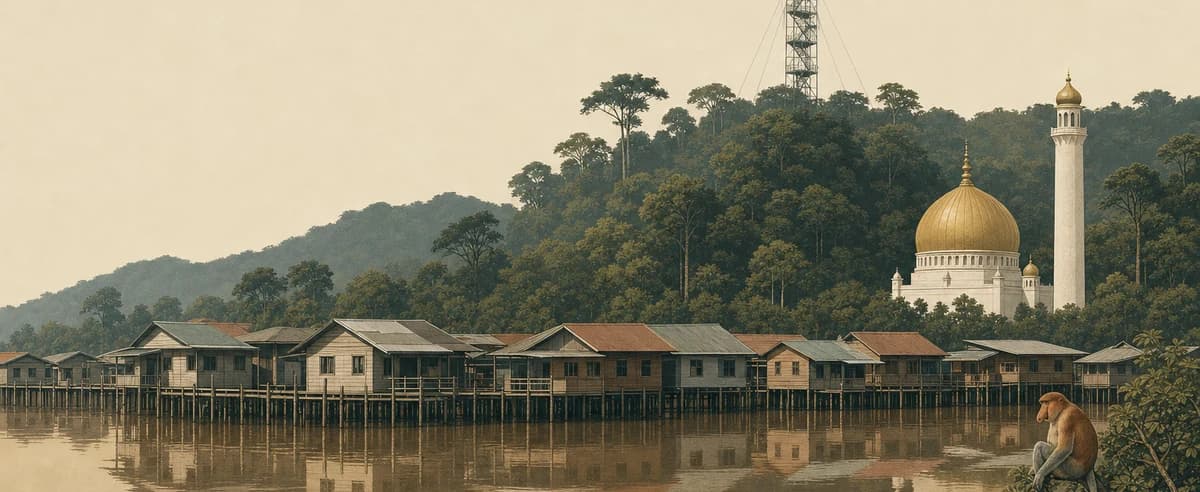 Brunei1 place
 Cambodia5 places
 China6 places
 Cyprus1 place
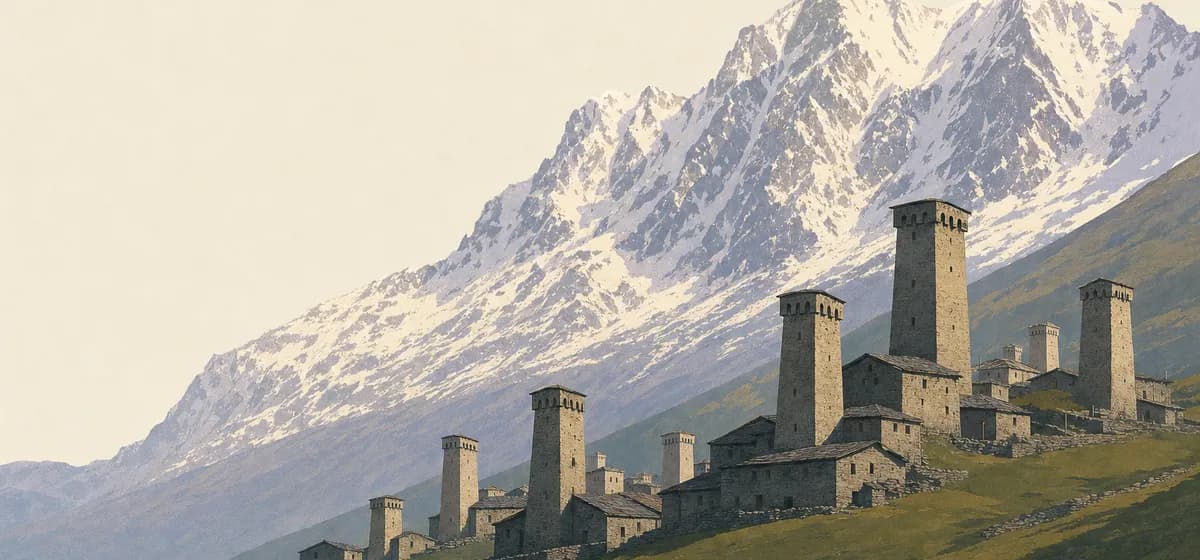 Georgia3 places
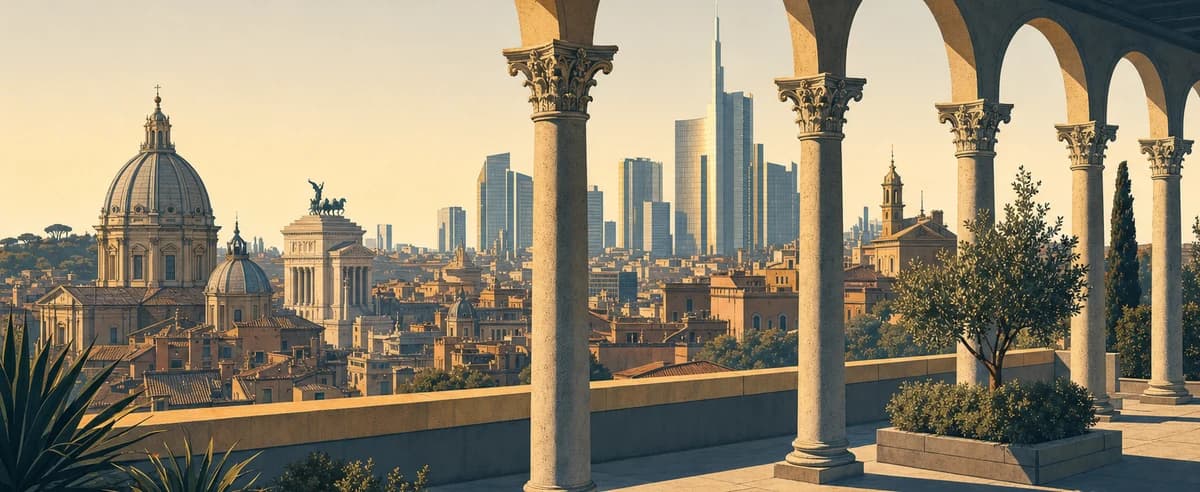 Hong Kong1 place
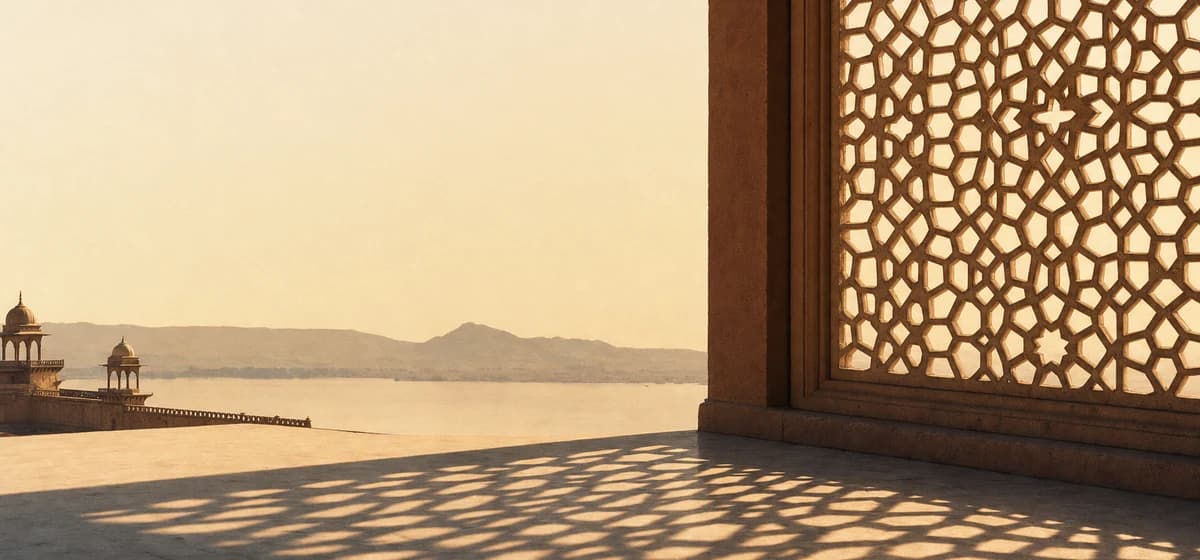 India14 places
 Indonesia13 places
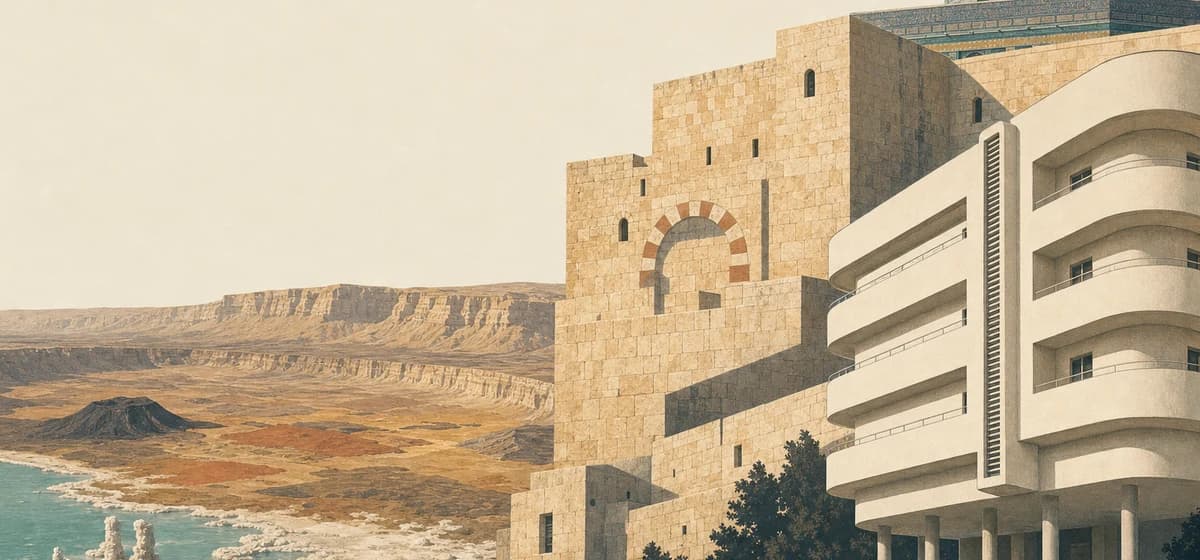 Israel3 places
 Japan18 places
 Jordan2 places
 Kazakhstan2 places
 Kuwait1 place
 Laos2 places
 Lebanon1 place
 Macau1 place
 Malaysia6 places
 Maldives8 places
 Mongolia2 places
 Myanmar2 places
 Nepal3 places
 Oman3 places
 Pakistan2 places
 Philippines4 places
 Qatar1 place
 Saudi Arabia4 places
 Singapore1 place
 South Korea3 places
 Sri Lanka4 places
 Taiwan1 place
 Thailand11 places
 Turkey6 places
 United Arab Emirates6 places
 Uzbekistan2 places
 Vietnam11 places
Africa
73 places · 21 countries
 Algeria1 place
 Botswana4 places
 Egypt3 places
 Ethiopia1 place
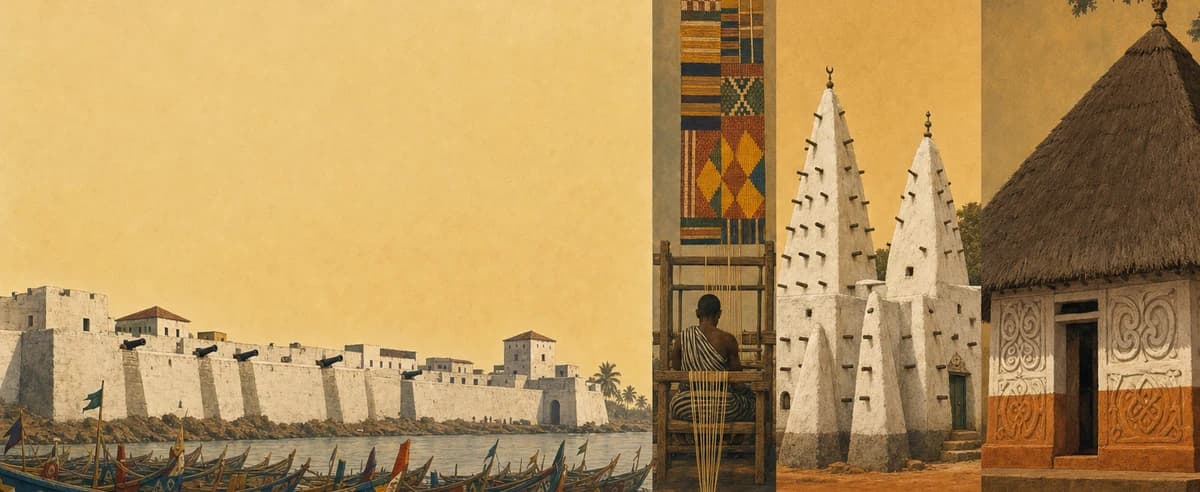 Ghana1 place
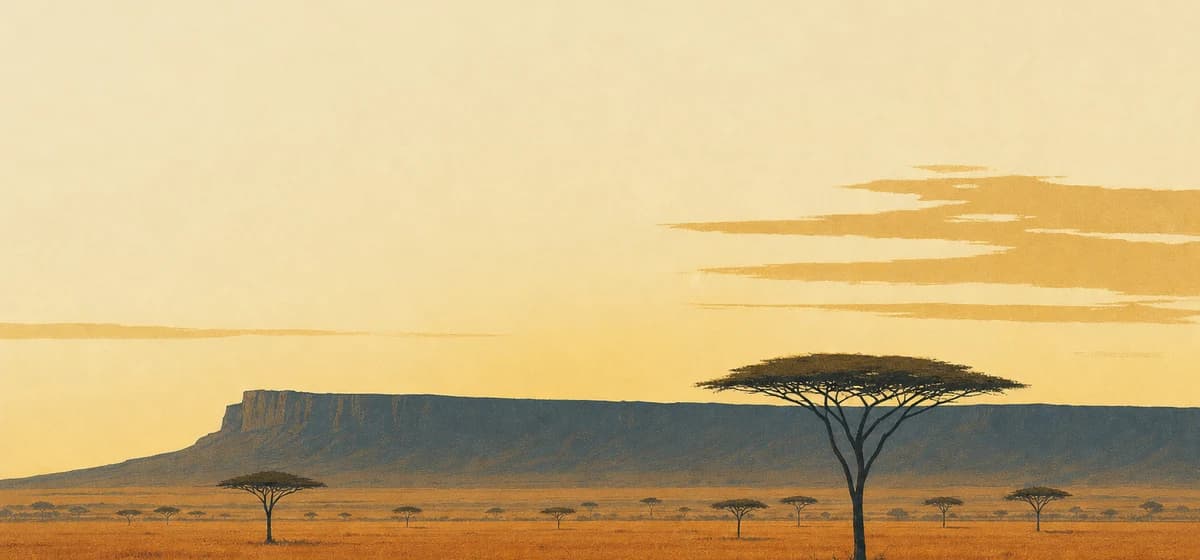 Kenya4 places
 Madagascar3 places
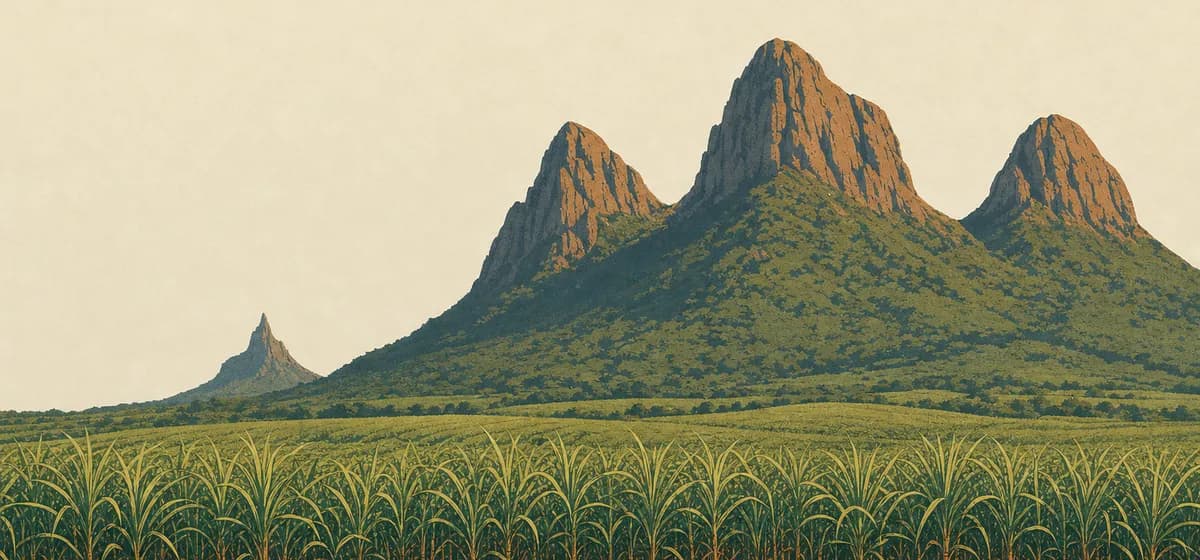 Mauritius2 places
 Morocco8 places
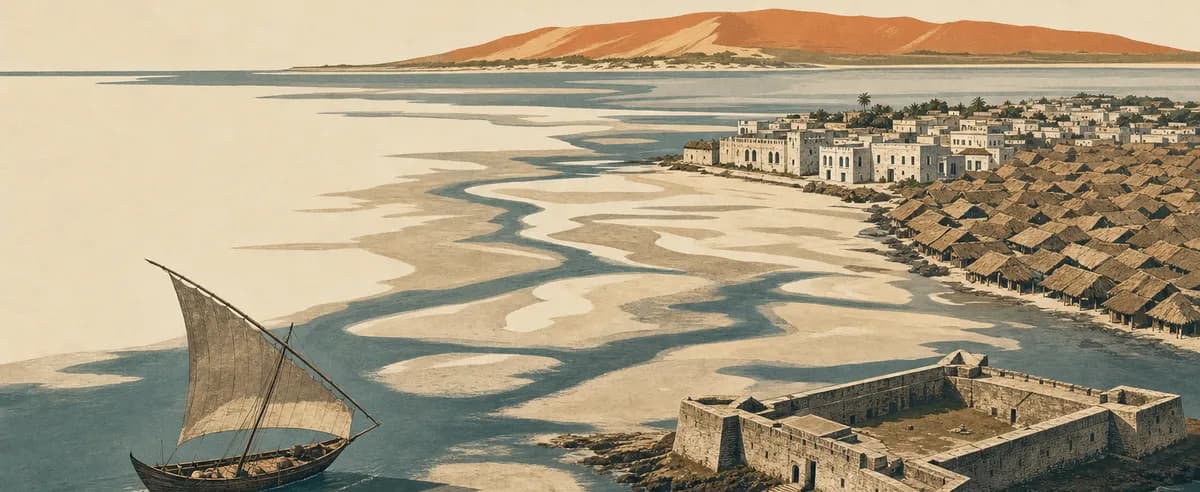 Mozambique2 places
 Namibia4 places
 Nigeria2 places
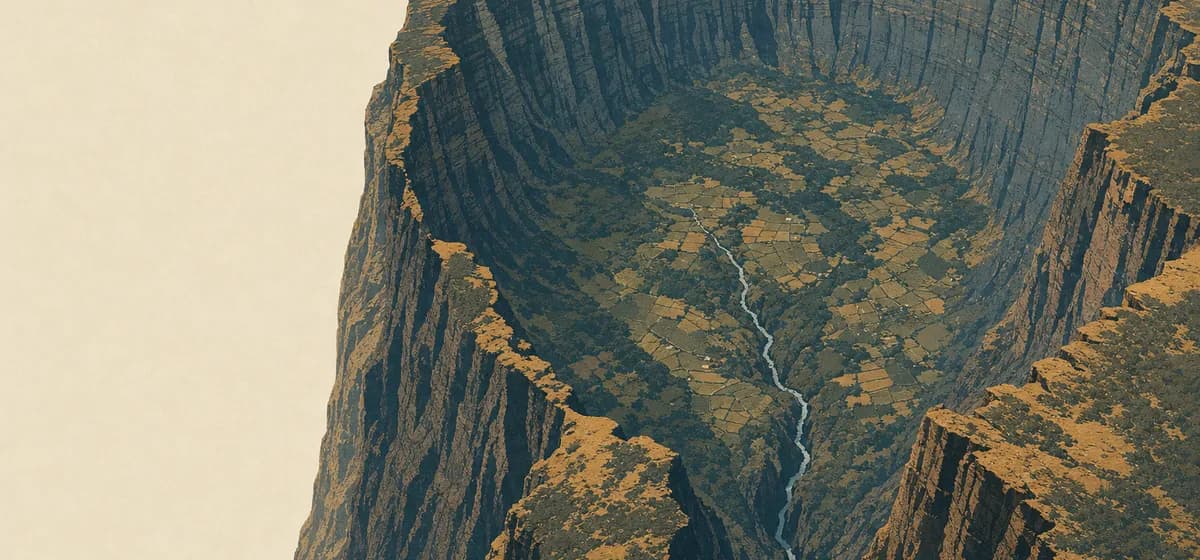 Réunion1 place
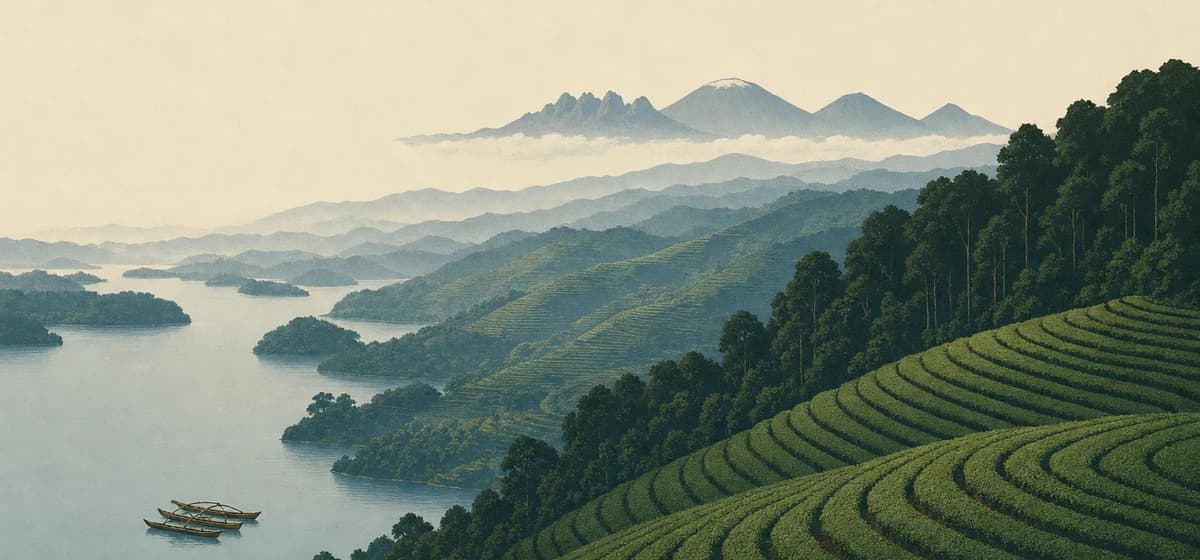 Rwanda4 places
 Seychelles4 places
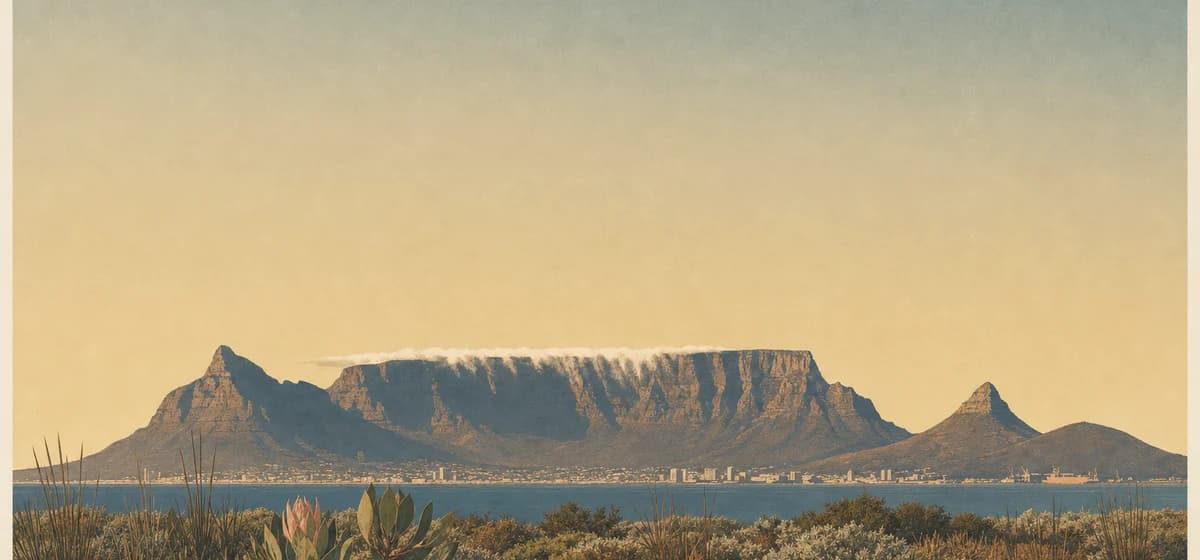 South Africa11 places
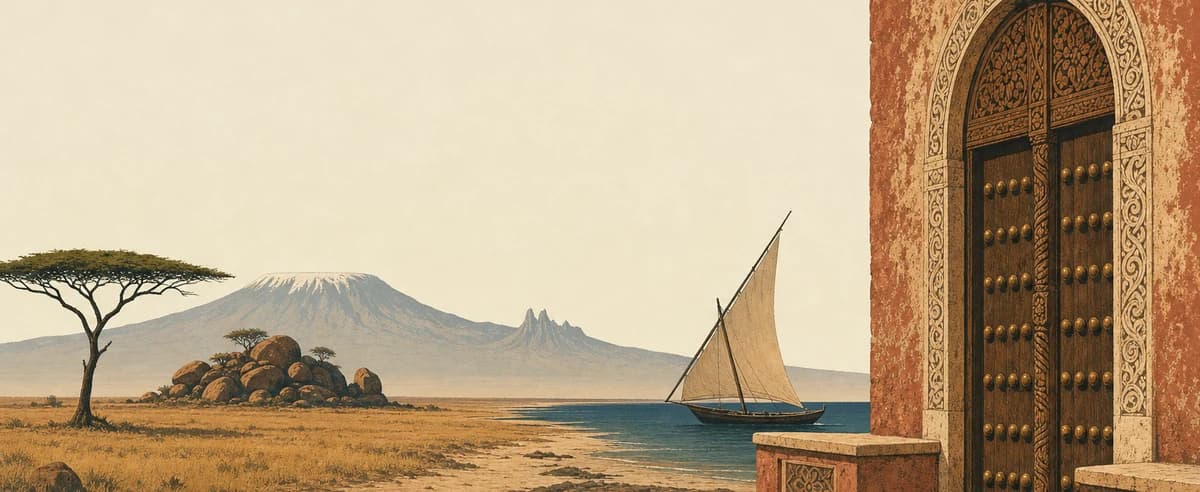 Tanzania11 places
 Tunisia1 place
 Uganda1 place
 Zambia2 places
 Zimbabwe3 places
Oceania
39 places · 6 countries